

The Cultural Fixation Index (CFST)
Measuring the cultural distance between societies from survey data
0countries on the 2020 scales, then home to about 85% of the world's population
0%of the world's population lived in the countries that supplied 96% of samples in top psychology journals (Arnett 2008)
0.00average cultural distance between US regions, against 0.11 between regions of India
Executive Summary
Most psychology studies draw their participants from the United States and other Western, educated, industrialized, rich and democratic (WEIRD) countries. In a 2020 paper in Psychological Science, Michael Muthukrishna, Adrian Bell, Joseph Henrich and colleagues presented the cultural fixation index (CFST), which measures the cultural distance between any two societies from survey answers. It extends a 2009 study in which Bell, Peter Richerson and Richard McElreath used the fixation index from population genetics to compare the cultures of neighboring countries.
In World Values Survey data from 80 countries, distance from the US correlated with many documented psychological differences, and distance from China with far fewer. WEIRD societies may be psychological outliers, researchers from WEIRD countries may have studied the traits on which their own societies stand out, or both.
Who's behind this
Michael Muthukrishna is Professor of Economic Psychology at the London School of Economics and Political Science and New York University, Founding President of the Center for Human Progress and lead author of the 2020 paper. His book A Theory of Everyone (2023) describes the index for general readers.

Key terms
Two problems in comparing cultures
What averages miss
Widely used measures, such as Hofstede's cultural dimensions, compare countries' averages, which largely ignore variation within a country. Brazil and Turkey score almost the same on Hofstede's individualism dimension (38 and 37), though beliefs and values vary more in Brazil. Economists and political scientists often use genetic or linguistic distance as stand-ins, but neither measures culture directly.
Which societies to compare
In 2020 most psychology samples still came from WEIRD countries, and tests of whether a finding generalizes often compared the West with East Asia. The authors found “no systematic method for determining which societies will provide useful comparisons” and asked “just how psychologically distant is the culture of China from Japan, the United States from Canada, or Azerbaijan from Zambia?”
How the index works
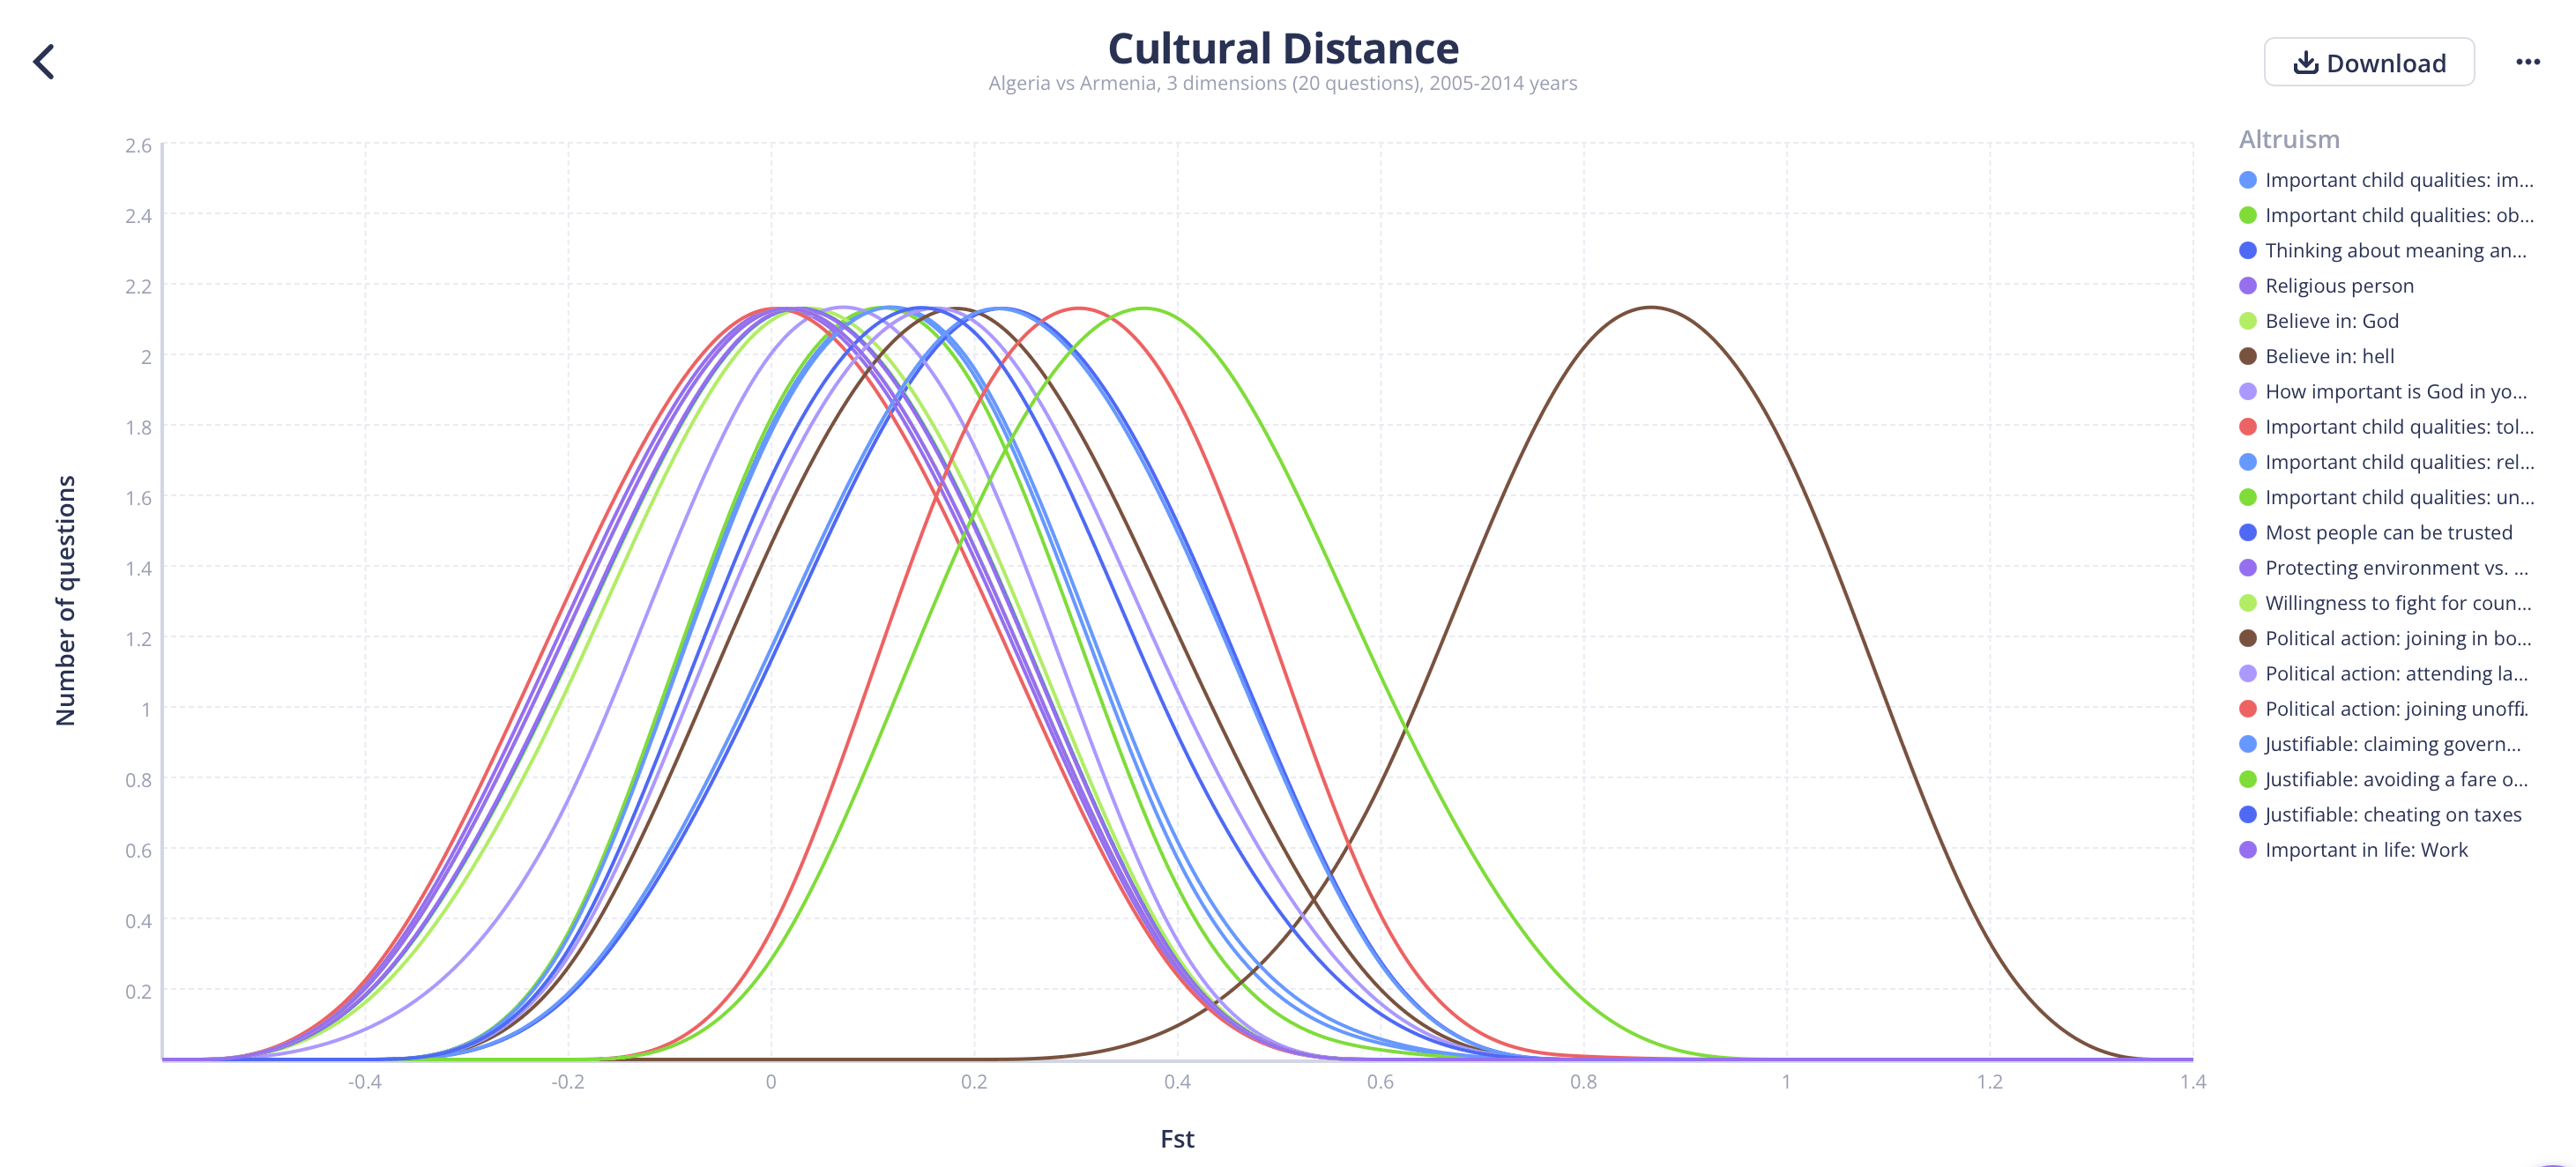
The CFST compares how often each answer to a survey question is given in two populations, then averages across many questions.
Borrowed from population genetics
In genetics, the fixation index measures the share of variation in gene variants that lies between populations. The CFST applies the same calculation to survey answers, for countries, regions, social classes or any other groups. Answers also reflect genes and personal experience, but the authors argue that the differences people express are what matters.
Answer frequencies
Comparing answer frequencies means the index does not assume that everyone in a society thinks alike or that every trait sits on one scale. To limit differences in answering style, the authors merged graded answers such as “very important” and “rather important.” They call this conservative, because differences in how strongly people agree or disagree stop counting.
Data and checks
The 2020 scales use World Values Survey answers from 2005 to 2014, given by 170,247 people in nationally representative samples from 80 countries. The authors kept questions they judged culturally transmissible, meaning learned from others, and report 95% confidence intervals. Recalculated 10,000 times from random halves of the questions, the scales correlated with the full scales at 0.95 (US) and 0.87 (China).
Case study: cultural distance from the US and from China
The authors built two example scales. The American scale measures distance from the United States, by a wide margin the most overrepresented country in psychological research. The Chinese scale measures distance from China, then the most populous country and a common comparison in cultural psychology.
Every distance on both scales was below 0.3, consistent with past research showing “that we have more in common across cultures than we have differences.” On the American scale, Japan (0.115), Hong Kong (0.090) and China (0.150), the non-Western societies psychologists study most, were nowhere near the far end, where Egypt sat at 0.234. Sweden (0.115) and Norway (0.124), both usually counted as WEIRD, were farther from the US than Mexico (0.077) or Brazil (0.072). Among four large populations, US regions were the most alike (0.01), against 0.05 in China, 0.11 in India and 0.09 between EU countries (regions with at least 100 respondents).
What the paper found and what remains open
| Row | What the 2020 paper found | What remains open |
|---|---|---|
| The US as outlier | Distance from the US correlated with many psychological differences, distance from China with far fewer. | Whether WEIRD societies are outliers, researchers chose traits on which they stand out, or both. |
| Coverage | 80 countries, then home to about 85% of the world's population. | The Middle East and Africa are thinly covered by the survey and by psychology. The authors expect the American scale to “continue to stretch.” |
| Design choices | Graded answers were merged, and the authors chose which questions count as culturally transmissible. | Others may keep the full range of answers, choose other questions or use another statistic. The survey's questions may themselves be biased. |
What the index is for
The authors hope the index will help researchers choose sites and samples different enough to test whether a finding holds elsewhere. In their example, a US finding gets a stronger test in Yemen than in Australia, but a finding from Turkey gets a stronger test in Australia than in Yemen.

Muthukrishna et al. (2020)
Psychological Science
How the index has been used since 2020
Muthukrishna co-authored the first two studies below, and Henrich, a co-author of the 2020 paper, co-authored the third.
1. Religion across borders
Cindel White, Muthukrishna and Ara Norenzayan applied the CFST to World Values Survey data from 88 countries (243,118 people). People who shared a religious tradition and level of commitment were more culturally similar within and across countries, even excluding overtly religious values. Country predicted cultural traits more strongly than religion did (PNAS, 2021).
2. Education and similarity to WEIRD countries
White and Muthukrishna used the CFST to compare people of higher and lower socioeconomic status in 95 countries (268,992 people). More educated people were more culturally similar to WEIRD countries in the English-speaking world and Western Europe, but not significantly more similar to China, Russia or India. Income and self-rated status did not show this pattern. Student samples may therefore over-represent WEIRD values (Nature Communications, 2026).
3. Language models
In a 2023 preprint, Mohammad Atari, Mona Xue, Peter Park, Damián Blasi and Joseph Henrich gave OpenAI's GPT the World Values Survey questions. Across 49 countries, the farther a country was from the US on the 2020 American scale, the less GPT's answers resembled those of its survey respondents (r = −0.70).
Published by Center for Human Progress (US) Inc., a 501(c)(3) organization